


NAPA VALLEY MARKET OVERVIEW
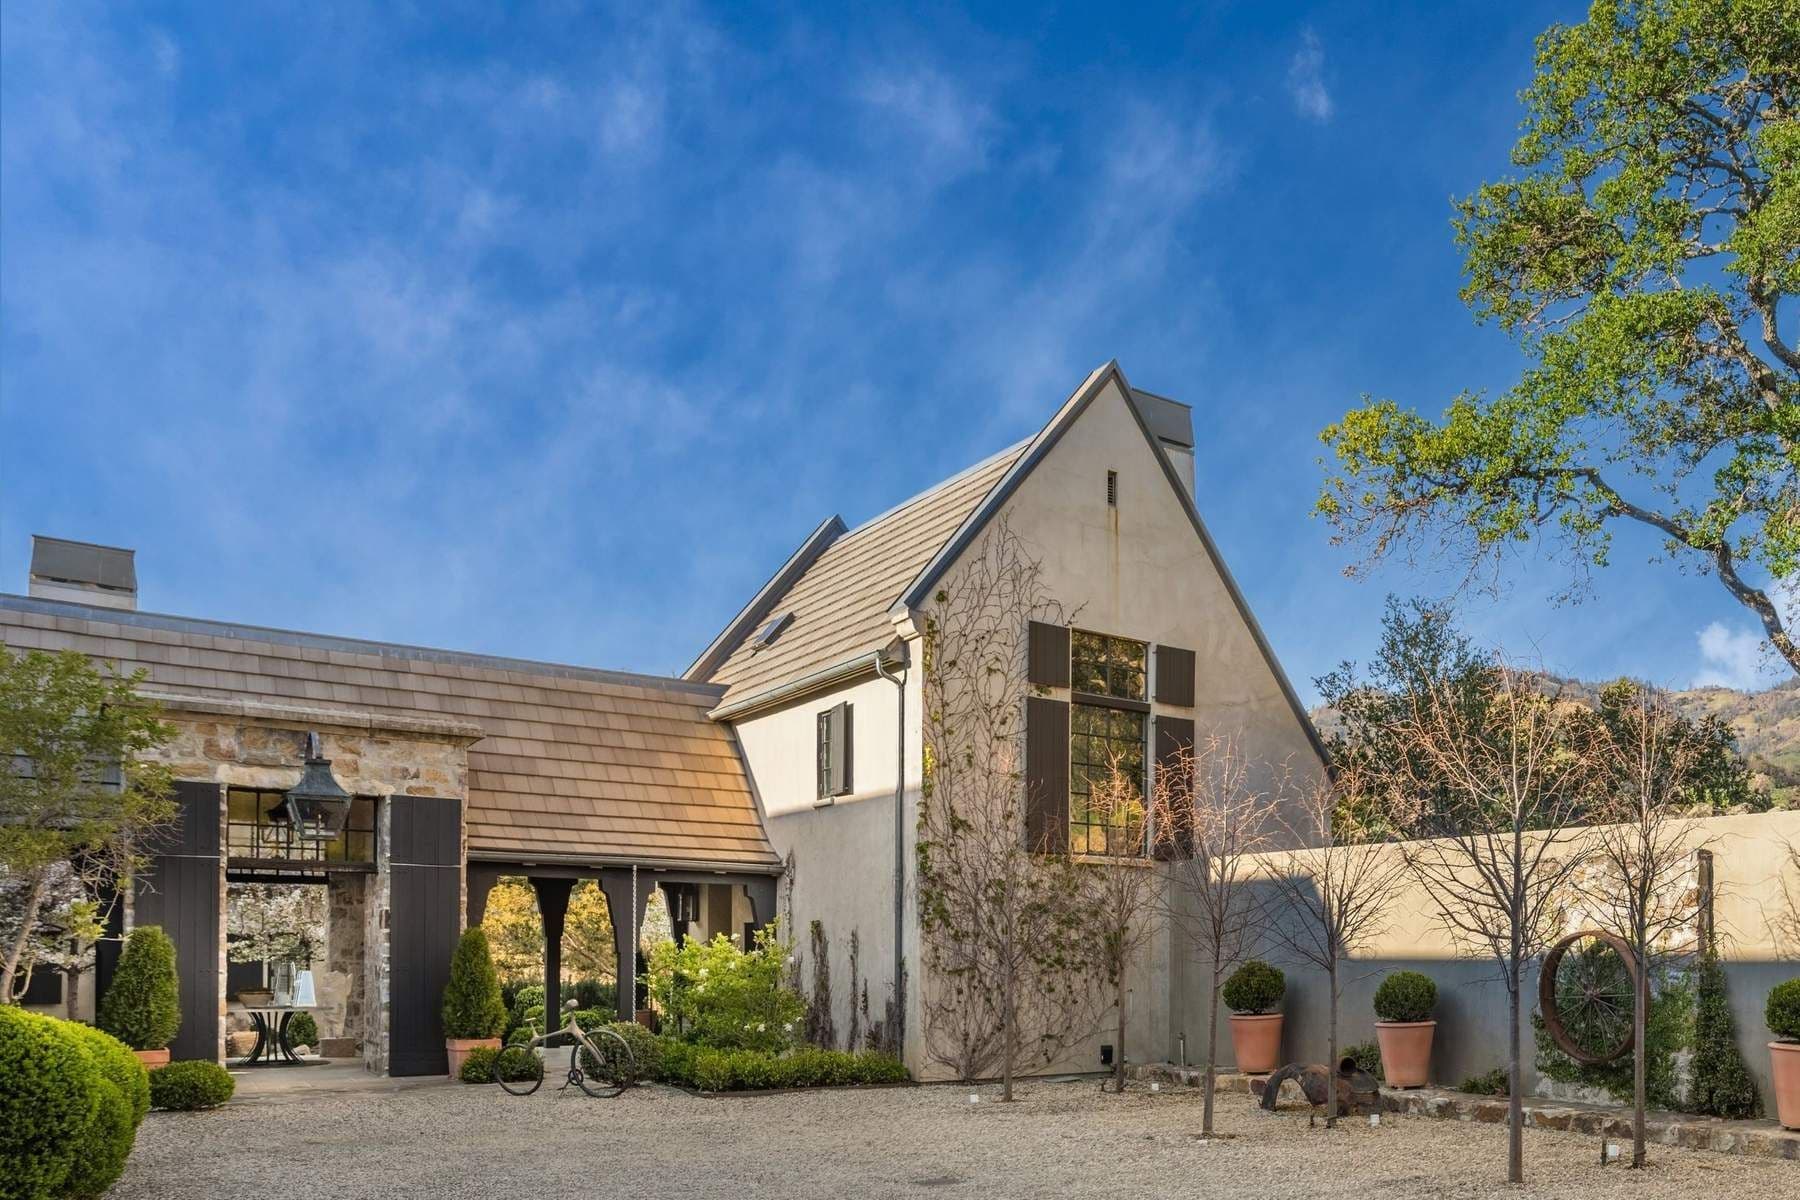
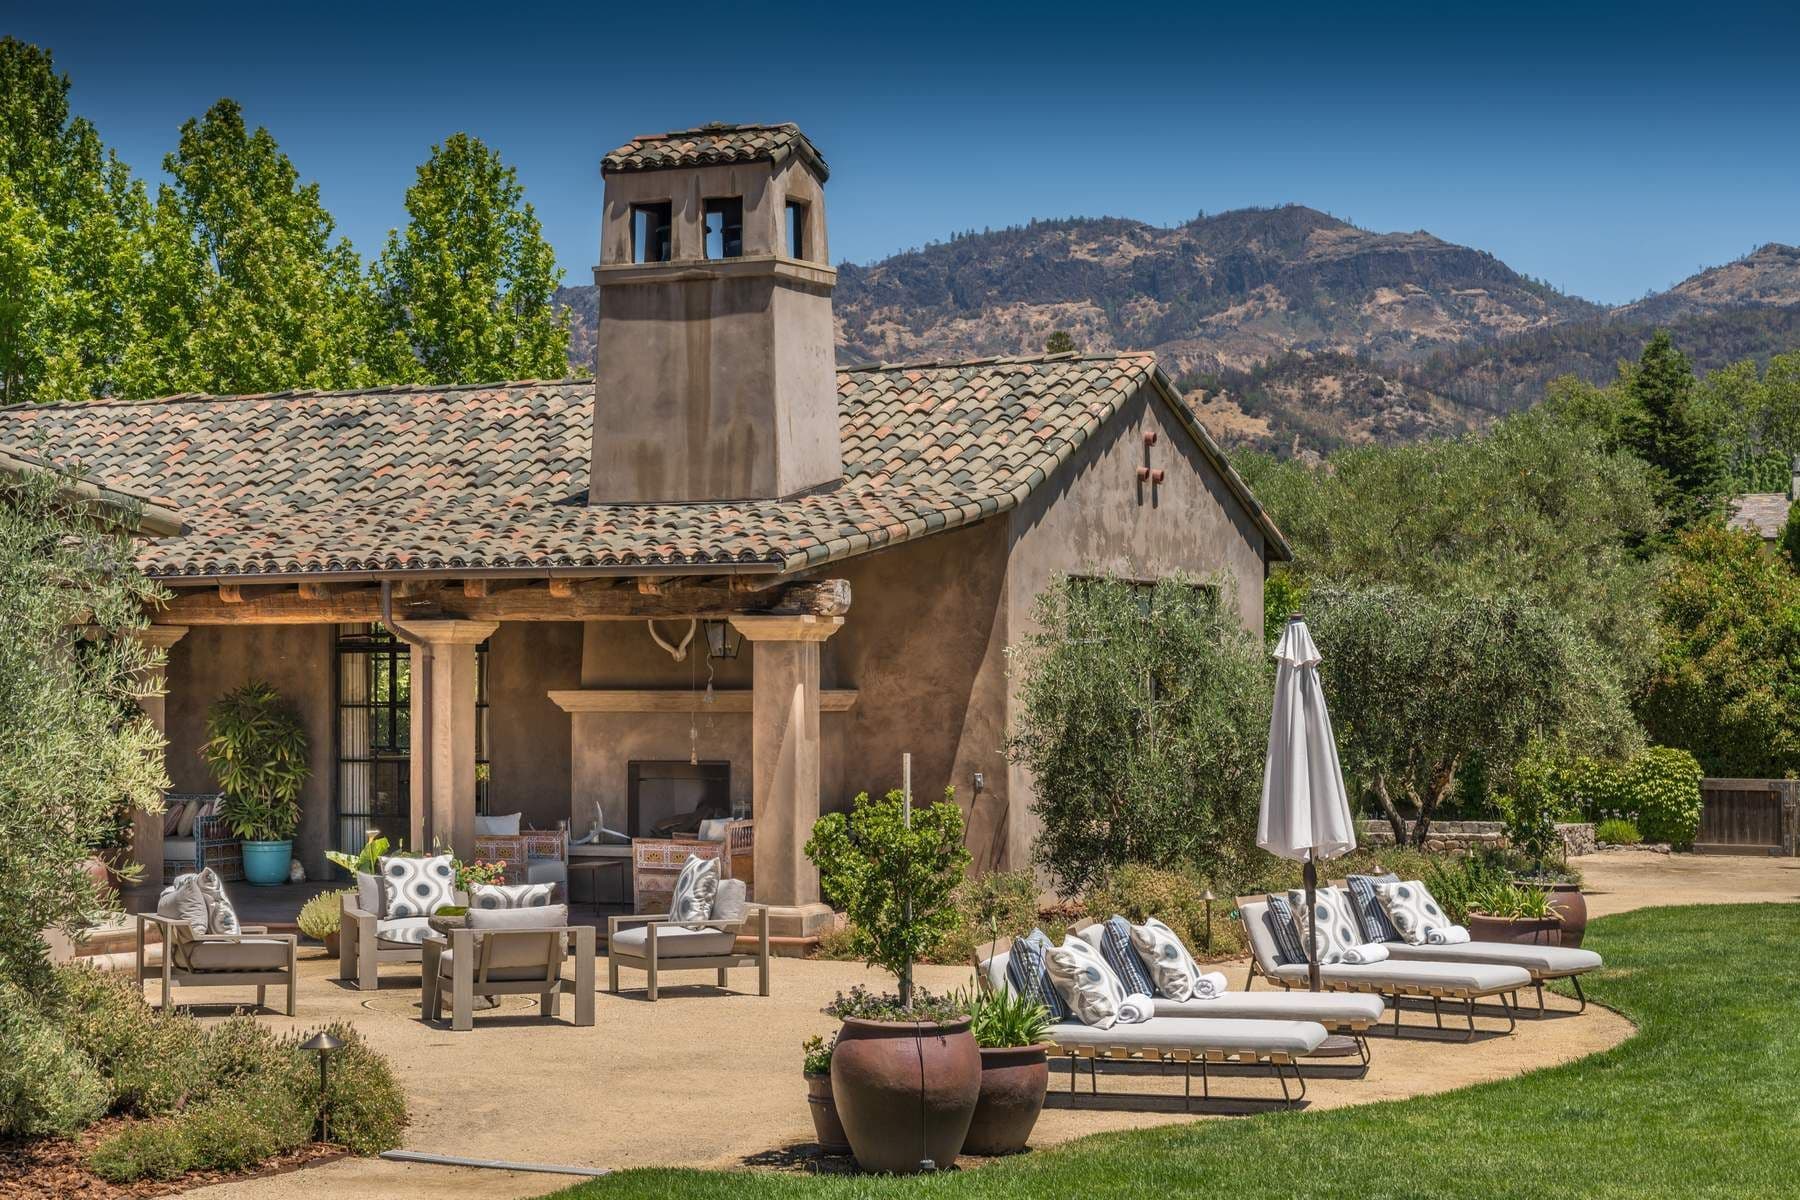
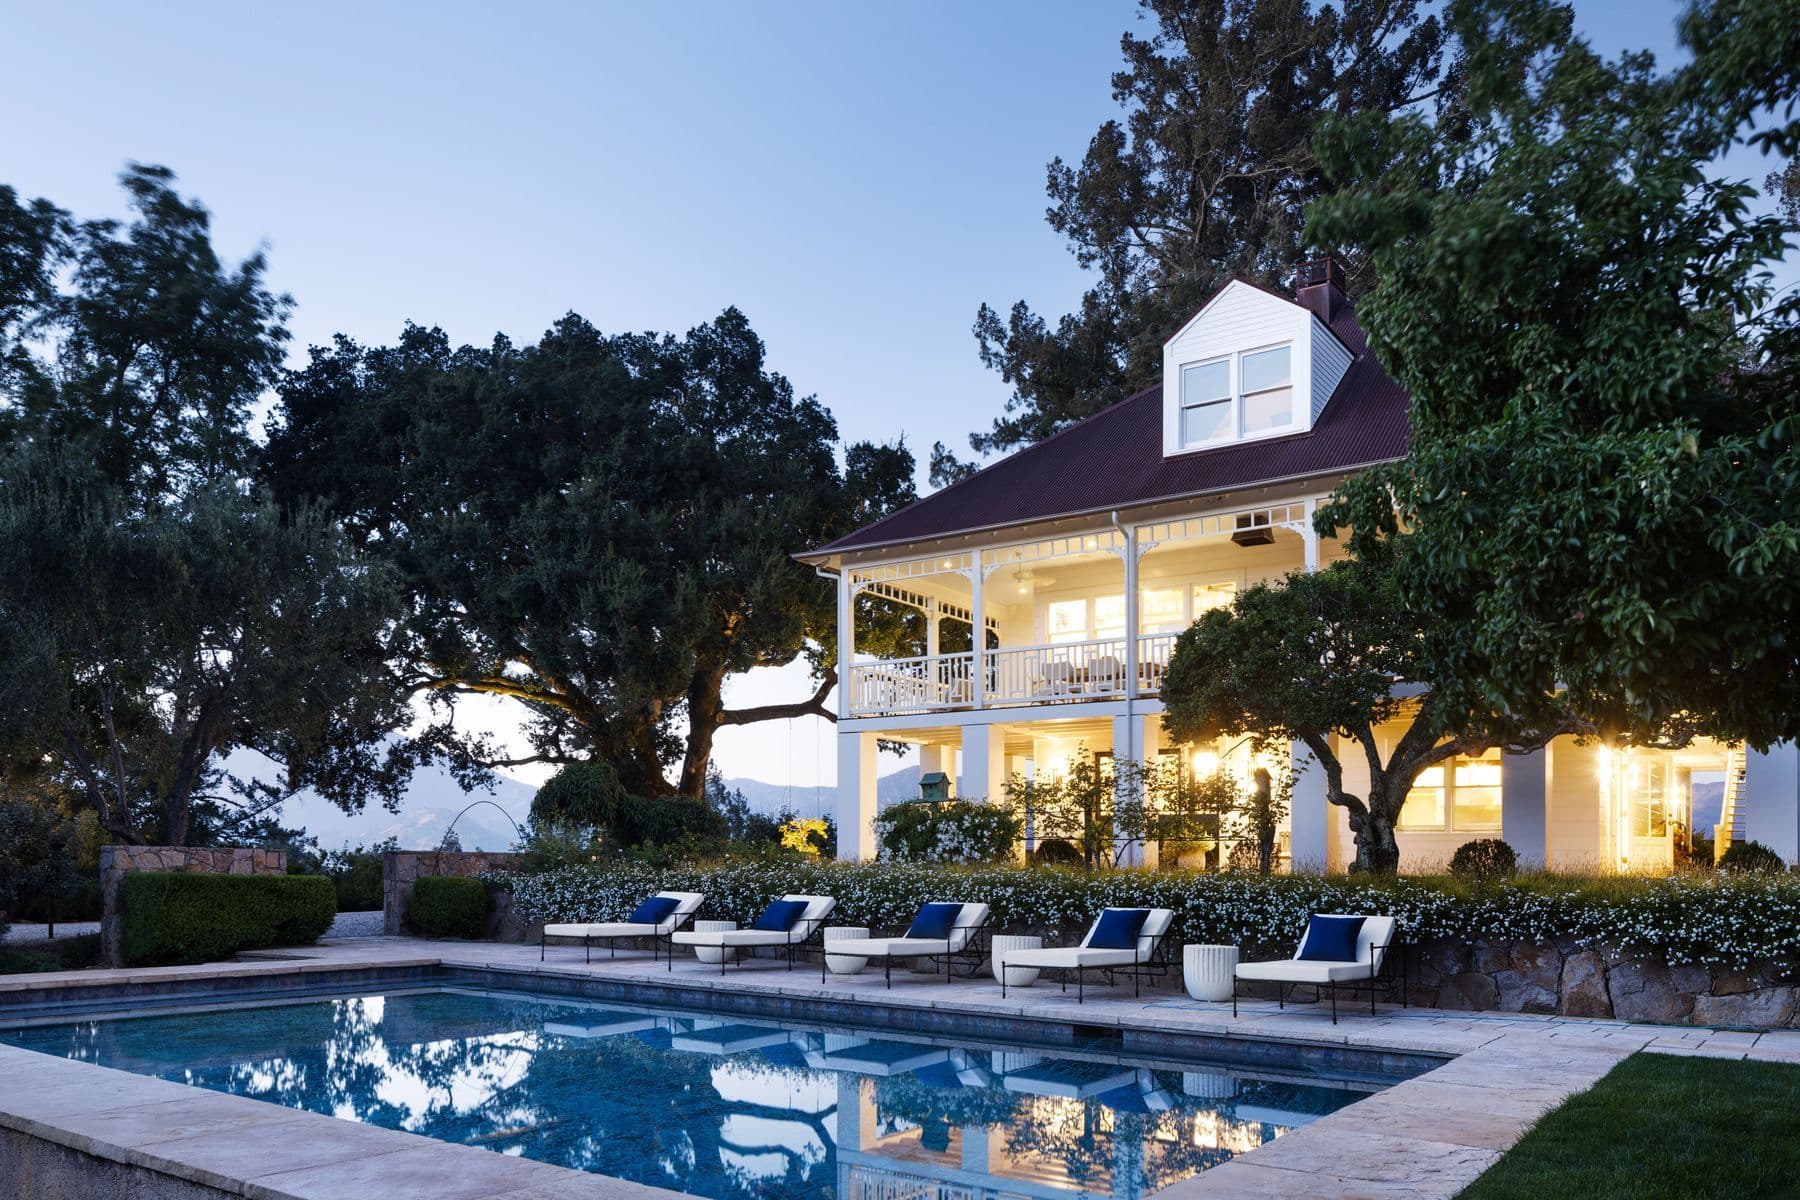
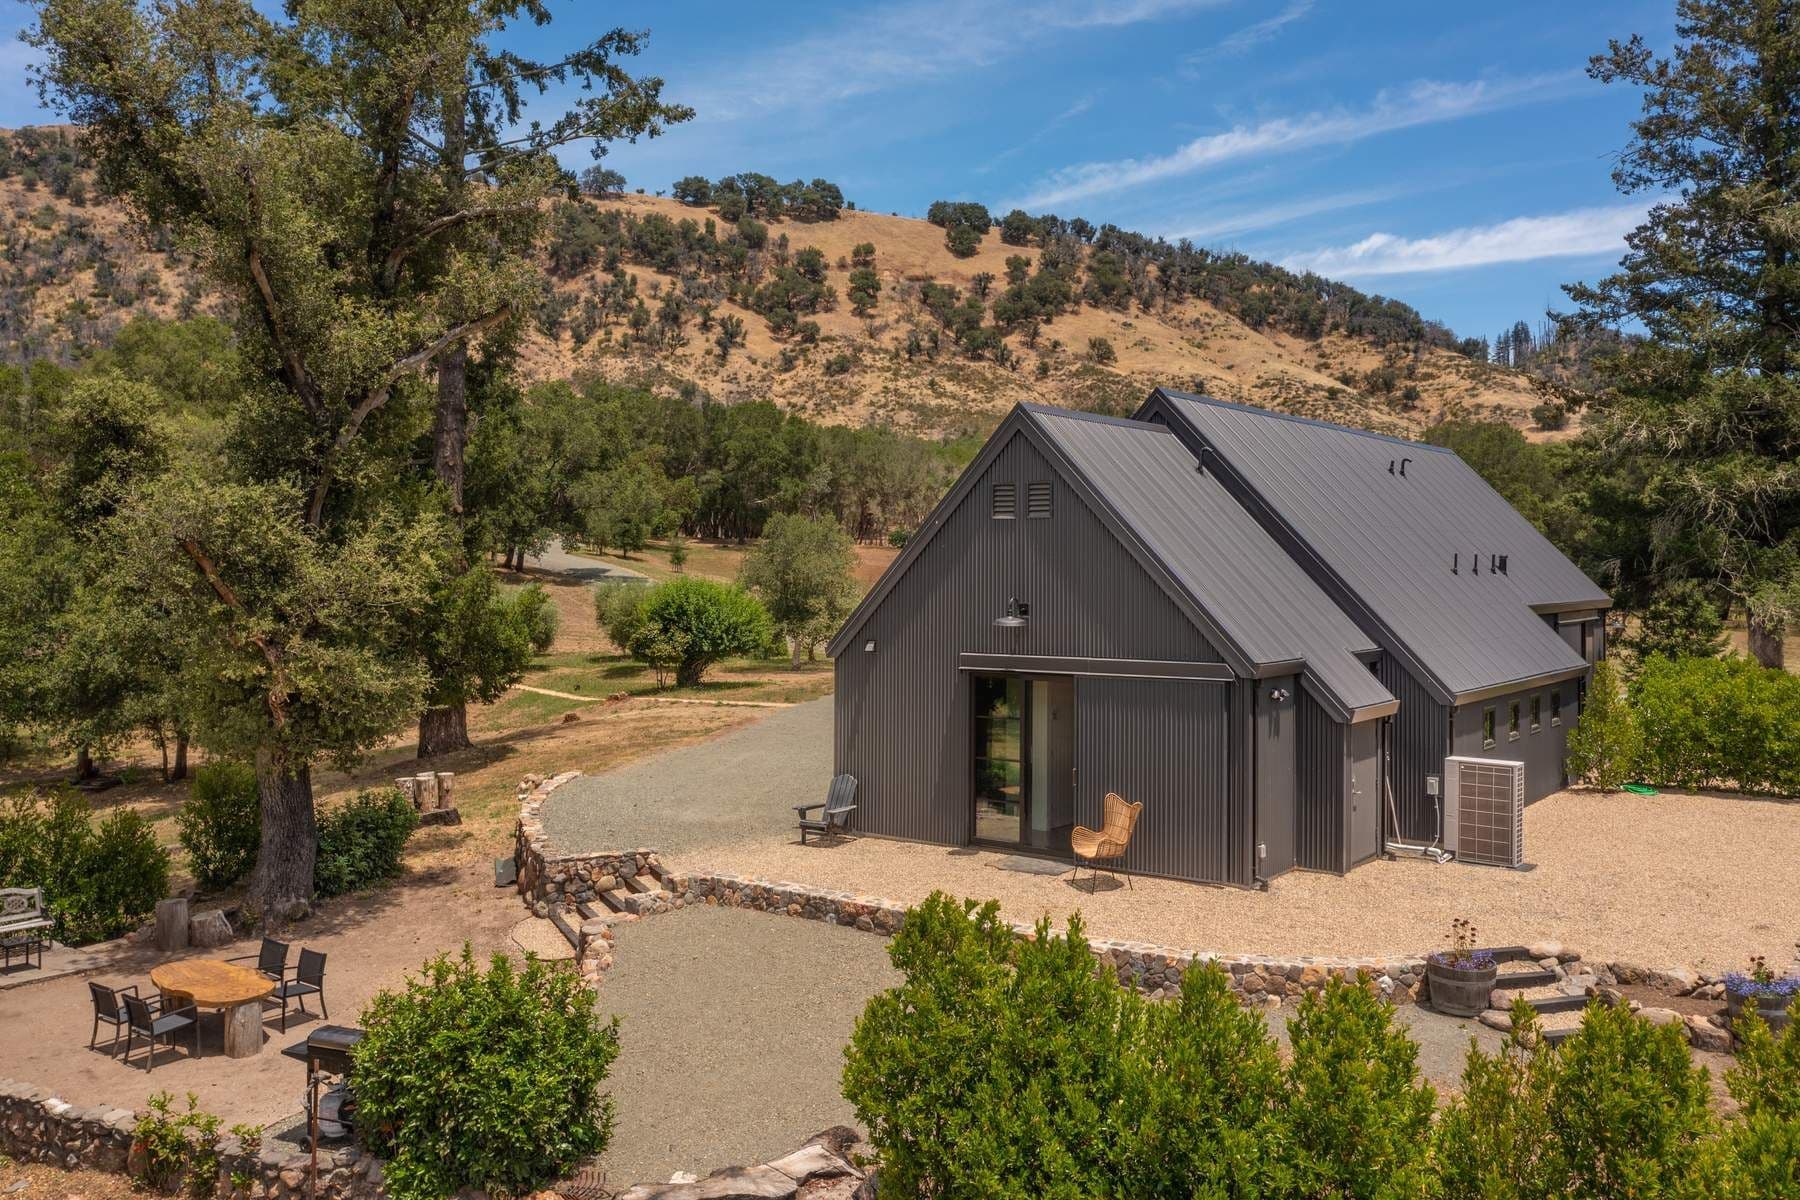
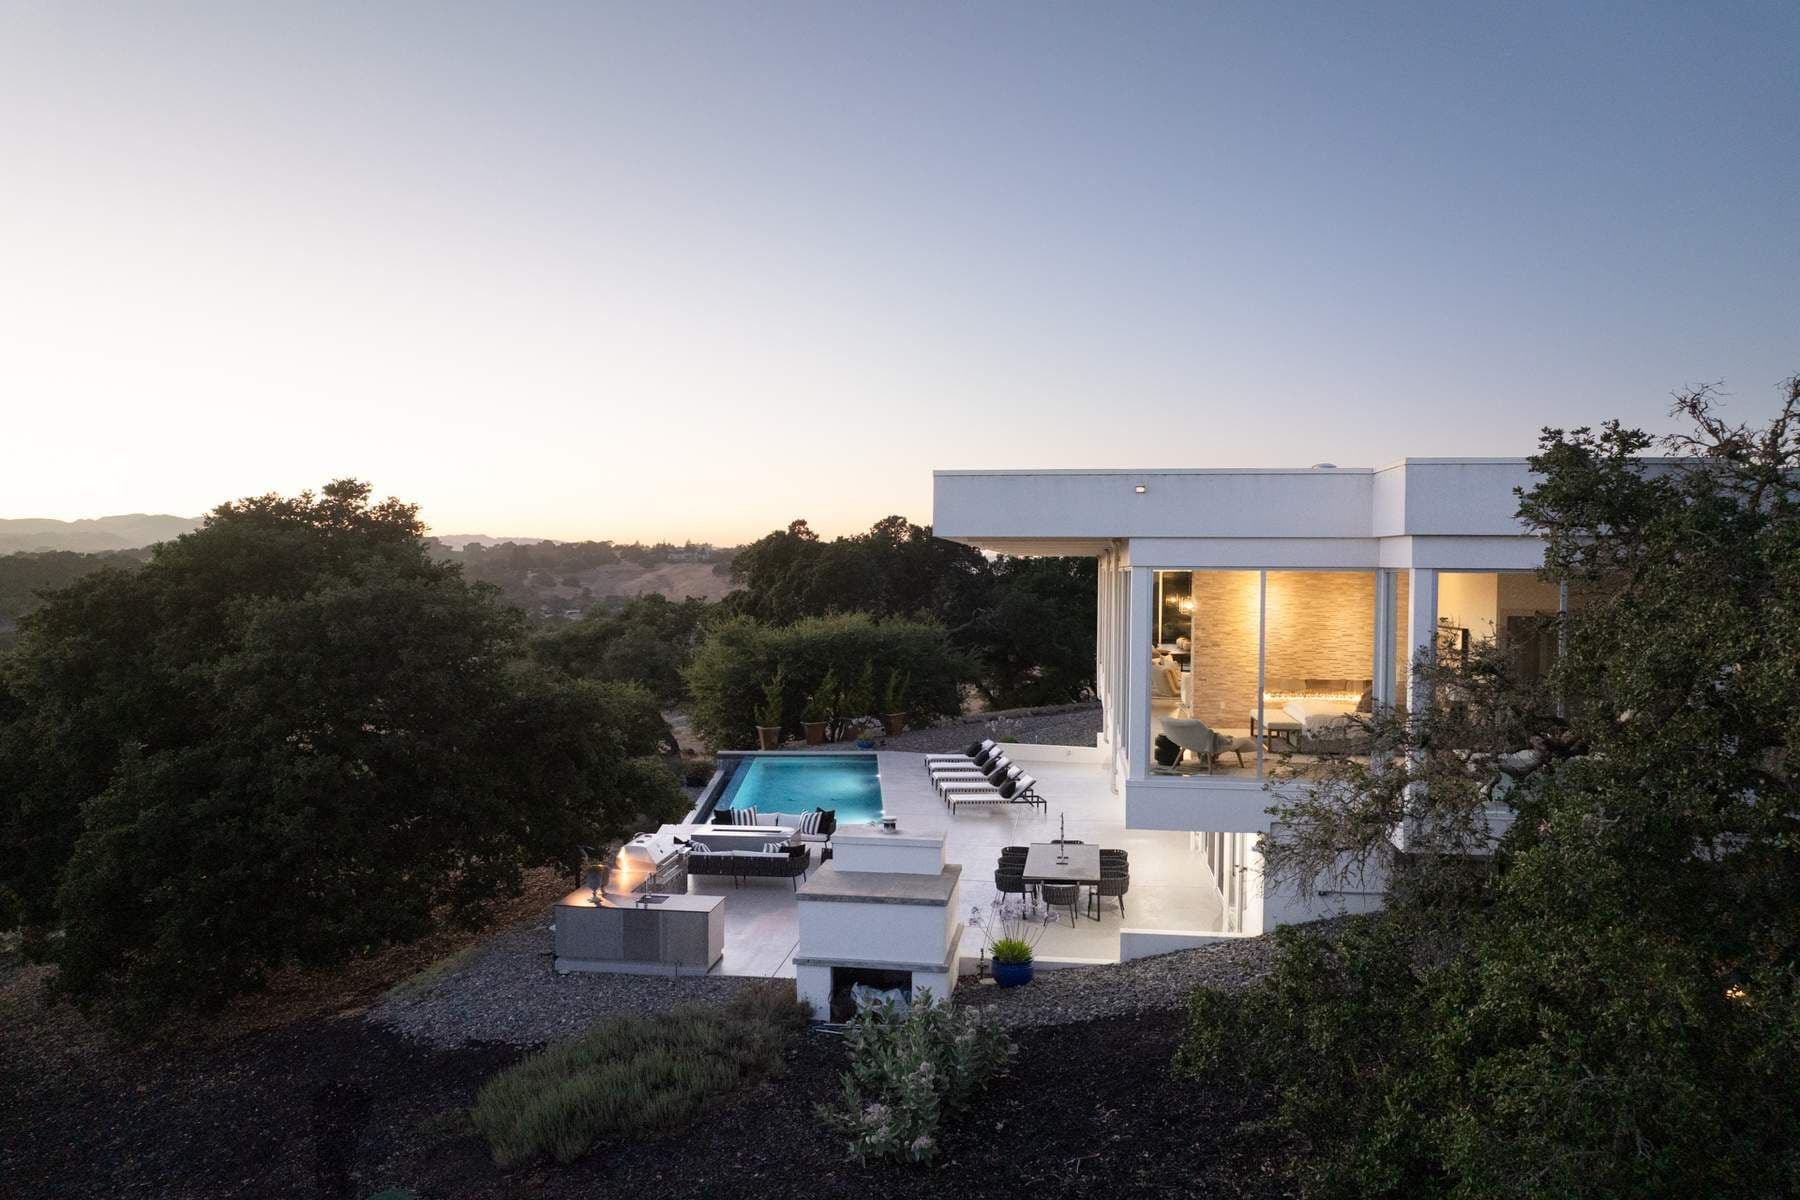
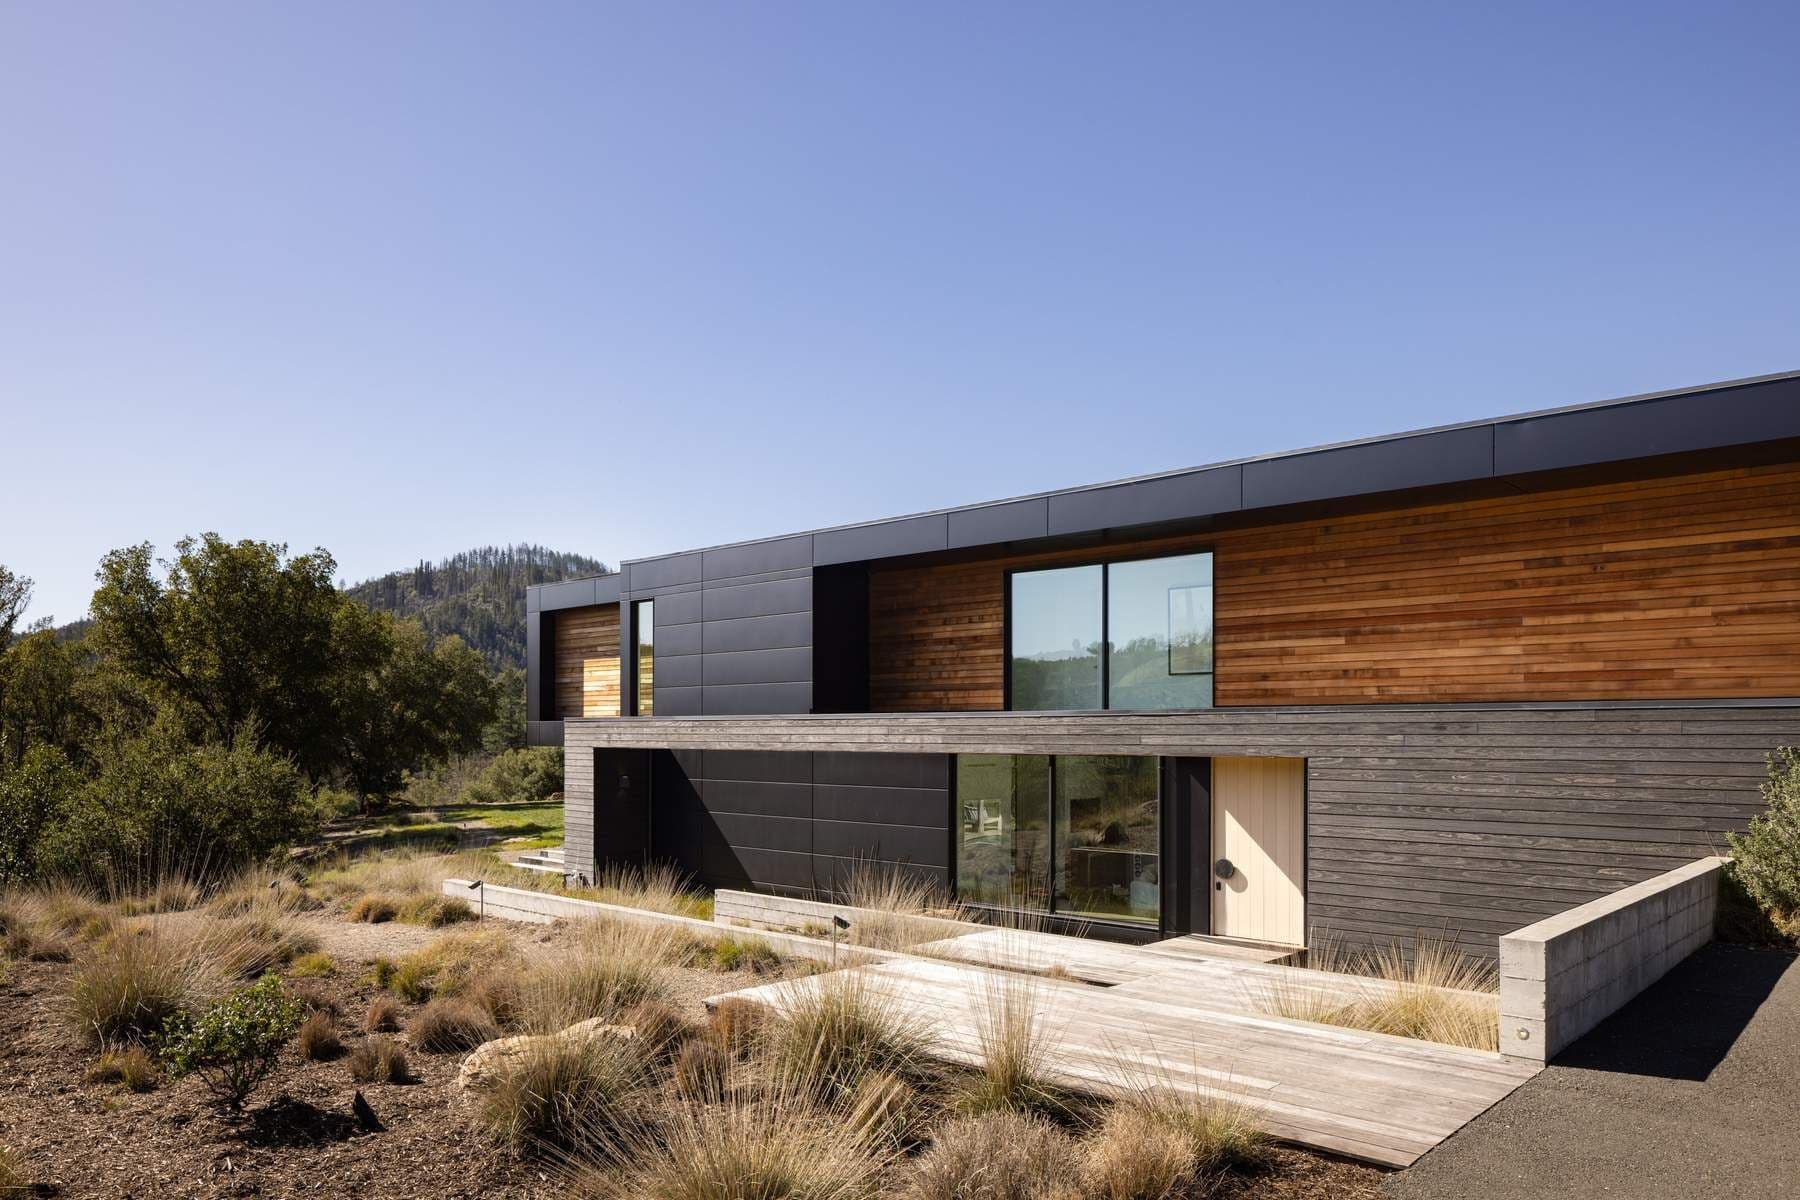
The Napa Valley real estate market combines prestige, luxury, and the world-famous wine country lifestyle that continues to attract discerning buyers from across the globe. Known for its acclaimed vineyards, Michelin-starred restaurants, and picturesque landscapes, Napa Valley properties represent some of the most desirable real estate in California.
Our Q2 2025 market analysis reveals the median home price has crossed the million-dollar threshold at $1,025,000, marking a significant milestone for the valley. The market is experiencing a notable shift with inventory levels surging 72.3% year-over-year, creating more opportunities for buyers across all segments.
Napa Valley's diverse micro-markets each tell their own story, from the vibrant City of Napa to the exclusive enclaves of St. Helena and Yountville. While transaction volumes have moderated, price appreciation continues at a sustainable 5.1% year-over-year rate, with luxury properties in St. Helena showing exceptional strength.
The current environment presents strategic opportunities for both buyers and sellers who understand the nuances of timing and location in this prestigious market. With 6.7 months of inventory, buyers enjoy greater selection and negotiating power, while well-positioned properties continue to achieve strong values.
NAPA VALLEY STATISTICS
Comprehensive metrics for the Napa Valley real estate market
MARKET INSIGHTS
In Q2 2025, Napa County's median single-family home price reached $1,025,000, up 5.1% year-over-year, crossing the million-dollar threshold and demonstrating continued strength in the luxury market despite higher interest rates.
Transaction volume showed signs of cooling with properties sold down 4.4% to 172 homes and contracts declining 8.2%, while average days on market increased to 52 days, suggesting a more deliberate pace among buyers.
Active inventory surged dramatically by 72.3% to 387 homes, pushing months of inventory to 6.7—firmly into buyer's market territory—creating more negotiating opportunities and selection for prospective purchasers.
While the list-to-sale price ratio softened slightly to 96.8%, price per square foot continued to appreciate at 3.2% to $615/SF, indicating that well-priced properties in desirable locations continue to command strong values.
MEDIAN SALE PRICE
$1,025,000
↑ 5.1% from Q2 2024
Year-over-year change in median single-family home price
AVERAGE DAYS ON MARKET
52
↑ 10.6% from Q2 2024
Average days until sale
PRICE PER SQ. FT.
$615
↑ 3.2% from Q2 2024
Median sales price per square foot
ACTIVE LISTINGS
387
↑ 72.3% from Q2 2024
Homes for sale at quarter's end
WENT INTO CONTRACT
178
↓ 8.2% from Q2 2024
Homes that went under contract
PROPERTIES SOLD
172
↓ 4.4% from Q2 2024
Closed sales in the quarter
LIST-TO-SALE PRICE RATIO
96.8%
↓ 0.5% from Q2 2024
Average sale price as a percent of list price
MONTHS OF INVENTORY
6.7
↑ 91.4% from Q2 2024
Active listings divided by monthly sales
Data reflects the most recent quarter compared to the same period last year. Market conditions vary by neighborhood and price point.
NAPA VALLEY AREAS
Explore individual market reports for each distinctive region within Napa Valley
Napa
The vibrant heart of the valley with diverse housing options and urban amenities.
MEDIAN PRICE
$985,000
↑ 3.7%
DAYS ON MARKET
49
↑ 22.5%
St. Helena
Luxury estates and vineyards in this prestigious northern Napa Valley town.
MEDIAN PRICE
$2,150,000
↑ 21.0%
DAYS ON MARKET
95
↓ 15.2%
Calistoga
Known for hot springs, hiking trails, and rustic wine country charm.
MEDIAN PRICE
$1,275,000
↑ 10.9%
DAYS ON MARKET
58
↑ 31.8%
Yountville
Small-town atmosphere with world-class dining and upscale residential options.
MEDIAN PRICE
$1,425,000
↑ 2.8%
DAYS ON MARKET
62
↑ 10.7%
American Canyon
Gateway to Napa Valley with more affordable housing and family-friendly communities.
MEDIAN PRICE
$715,000
↑ 3.8%
DAYS ON MARKET
35
↓ 7.9%
Angwin
Secluded hillside community with forested estates and dramatic valley views.
MEDIAN PRICE
$895,000
↑ 3.5%
DAYS ON MARKET
62
↑ 8.8%


Stay Informed & Inspired
Join our community and receive curated insights on luxury properties, market trends, and exclusive opportunities in San Francisco & Wine Country.